

Untangling the Octopus
Using Home Assistant to work out if Octopus Energy's agile tariffs might be better for me.

The UK’s Octopus Energy offers, like most energy suppliers, various tariffs. I was recently alerted to their agile pricing tariff for electricity. In summary (from their website):
With Agile Octopus, you get access to half-hourly energy prices, tied to wholesale prices and updated daily. So when wholesale electricity prices drop, your bills can too – particularly if you can shift your daily electricity use outside of peak times.
But the following particularly intrigued me:
Across the UK, whenever more electricity is generated than consumed, energy prices fall – very occasionally, to the point where prices drop below zero.
What, I thought, we could be paid for using electricity?! I needed to investigate further.
Could it be worth it?
We are not heavy users of electricity, neither our heating nor our hot water uses electricity. We do have an immersion heater we never use but, in theory, with a smart switch it would be possible to switch it on when the agile tariff turns -ve, maximising any benefit from the agile tariff.
The obvious way to work out if it might be worth it is to compare the costs under our current tariff with the costs if we were using the agile tariff. (Obviously, past performance does not predict future performance - the agile tariff can change dramatically at very short notice.)
Accessing the necessary data
To do the comparison, I’d need our consumption data (in kWh), the tariffs in effect at each half hour (in £/kWh), and the £ cost (which obviously is consumption x tariff but provides a useful control).
We have a smart meter so our consumption is available on a half-hourly basis and Octopus provide a full api to enable anyone to get their consumption, cost and tariff data. Home Assistant even has an Octopus Energy integration, how hard could it be?
As it turned out, this ended up being the most technically challenging problem I’ve had with HA since I started using it (hence the length of this post). The difficulty was with storing all this data and then using it in a way that allowed the comparisons I wanted. (Spoiler alert: I had to work out how to insert data into InfluxDB and delete data from it!)
Where to store the data
All of the data I would be using is what’s called time series data - in this case, it all changes every half hour. So, for example, there’s the consumption, tariff(s) and costs at 09:00, which then have new values at 09:30, and again at 10:00, and so on.
HA doesn’t handle time series data very well. Moreover, the ever increasing data will lead to a HA database that steadily increases, with consequential impacts on performance and backup sizes. I quickly eliminated using the HA database for this data and instead looked for a database that is designed for time series data and chose InfluxDB. It integrates easily with HA.
Installing InfluxDB in HA was straightforward, I simply followed the instructions. There are many videos explaining how to install and use InfluxDB, see this for example. This also covers Grafana which I use later in this article. I installed the InfluxDB add on, created a database (called homeassistant) and added the following to my configuration.yaml (I’ve started with collecting almost every sensor but I will probably reduce this over time):
# Configure influxdb
influxdb:
  host: 172.16.0.125
  port: 8086
  database: homeassistant
  username: !secret influxdb_user
  password: !secret influxdb_pw
  max_retries: 3
  default_measurement: state
  include:
    domains:
      - sensor
After a reboot, I was good to go!
Getting the data into InfluxDB
I now had a database but I needed to get the Octopus data into it. I found this very useful project that explains how to get Octopus Energy’s agile tariff into HA using Node Red. Following the author’s instructions was fairly straightforward. The only issue I had was that the sensors created to hold the agile prices seemed to hang. I cured this be deleting the entity configuration nodes and recreated them using a different name.
Every half hour the agile price is updated and this finds its way into InfluxDB without any effort. Nice!
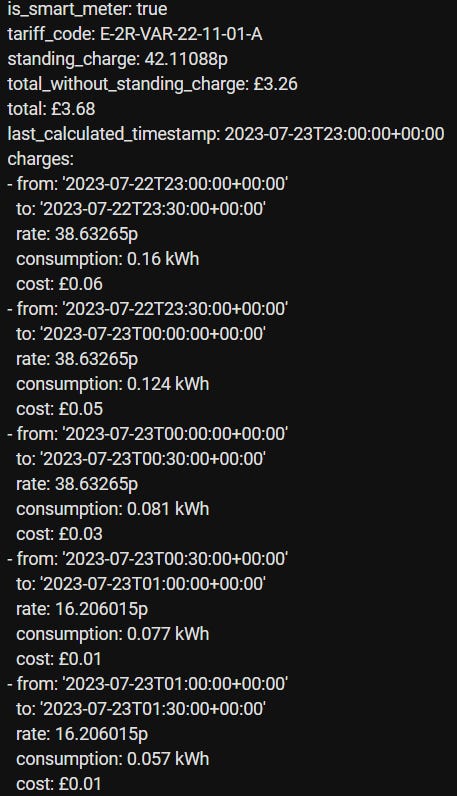
Next I wanted my consumption, tariff and cost data. I was already using this Octopus Energy integration and initially thought all I needed to do was find the associated half hourly data in InfluxDB, but only the tariff data was there. Looking at the sensors the integration creates, I quickly understood why. Below is a clip of some of that data (without anything that might identify my meter). Basically, much of the data I’m interested in is stored as attributes of the _previous_accumulative_cost sensor.
So I just need to extract this data and insert it into InfluxDB using Node Red. This was where I hit a brick wall that needed quantum tunnelling to get through. All my Googling found nothing that explains how to insert data into InfluxDB and many articles suggested it couldn’t be done.
Fortunately, I came across the formal InfluxDB documentation and specifically this page which describes the api. The POST method for inserting data into InfluxDB is detailed towards the bottom. I have used this with Node Red as follows:
Once a day, read the _previous_accumulative_cost sensor
Cycle through all 48 of the entries of the charges array extracting the time/date, consumption and cost data
Construct an object with this data in the format required by the InfluxDB POST api
Call the POST method to insert the data
My Node Red flow for this looks as follows:

The Consumption node sends the entity in msg.data to the Build POST data node that has the following javascript in the On Message tab to build the POST data:
const NoValues = 48;
var build_payload = "";
// Loop oover the 48 half hourly data values
for (let i = 0; i < NoValues; i++) {

    var Data = msg.data.attributes.charges[i].from;
    var data = Data.split("T");
    var time = data[1];
    data = data[0].split("-");

    var year = data[0];
    var month = data[1] - 1;    //notice the -1
    var day = data[2]

    time = time.split(":");
    var hours = time[0];
    var mins = time[1];
    var secs = 0;
    var d = new Date(year, month, day, hours, mins, secs);
    //msg.payload = d
    var timestamp = d.getTime() / 1000; // s, not ms accuracy needed
    build_payload += "kWh,entity_id=electricity_consumption,domain=sensor this_half_hour_use=";
    build_payload += msg.data.attributes.charges[i].consumption.replace(/[^0-9.]/g, ''); // Strip non numeric characters
    build_payload += " " + timestamp + String.fromCharCode(10);
    build_payload += "GBP,entity_id=electricity_consumption,domain=sensor this_half_hour_cost=";
    build_payload += msg.data.attributes.charges[i].cost.replace('£', "");
    build_payload += " " + timestamp + String.fromCharCode(10);
}
msg.payload = build_payload;
return msg;
A few points worth noting:
Months are 0-11, not 1-12, hence the - 1
I only need second accuracy, so the timestamp needs to be divided by 1,000 to get it from ms to s
The data for consumption and cost includes units, these need removing (but the decimal point must remain)
This creates two sets of data in the database, both with domain=sensor and entity_id=electricity_consumption:
one with measurement of kWh and the data stored in the field this_half_hour_use
one with measurement GBP and the data stored in the field this_half_hour_cost
Having constructed the POST object, this is passed in the msg.payload to the Insert into influxDB Node Red http request node. This uses a method of POST and the url http://172.16.0.125:8086/write?db=homeassistant&precision=s (obviously you’d replace the ip address with your own HA’s ip address). I checked the Use authentication box and entered my database’s credentials. The msg.payload is appended and the data inserted into InfluxDB.
Now once a day my consumption and cost data is inserted into InfluxDB. A short example of this data in my InfluxDB is shown below:

As an aside, I found the tool InfluxDBS Studio. It is easier to browse the database with it and it also allows data to be easily deleted (during my trials I created a lot of erroneous data), something that is all but impossible otherwise.
Analysing the data
I now had the data I needed in a usable form with consistent time stamps. All I needed to do some analysis on it to see how the agile tariff compares with my existing tariff. For this, I decided to use Grafana. It seems to be the standard tool used with InfluxDB. I won’t go into any detail here about installation and general use (the link I gave earlier on installing InfluxDB describes this in better detail than I could). Instead I’ll limit my discussion here on my early results and how I got them.
Below is a screenshot of one of my Grafana graphs. This shows:
my current tariff (as it’s an Economy tariff, it alternates regularly between two values)
my consumption, the green line that has the large peaks (these are when our dishwasher and washing machine come on overnight in the economy 7 cheaper period)
my costs from Octopus Energy and my costs calculated by multiplying my consumption with my current tariff at each half hour (this is a good validation check - they should be the same, which they are within rounding errors)
the agile tariff
what my cost would have been had I been on the agile tariff calculated by multiplying my consumption with the agile tariff at each half hour

I’ve zoomed into a section where the purple agile cost is usually lower but in the low rate period the agile cost is higher.

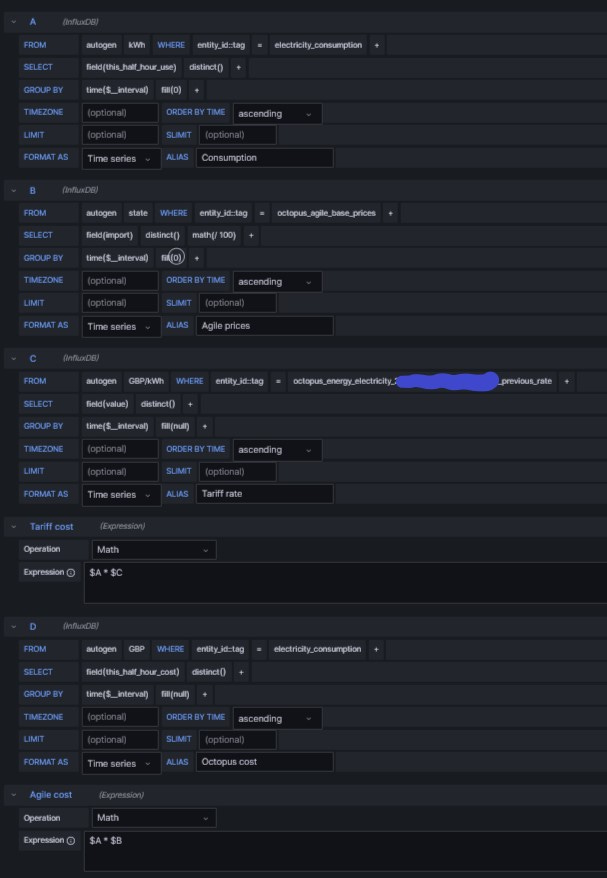
The queries I used to generate this graph is shown below. Note I had to use distinct in most of them as without it, the queries returned no data. I haven’t tried to understand why since, as long it works, I’m happy!
One thing this whole exercise reminded me is why people like Excel!
Going forward
I’m now looking at this graph every day to see how the two tariffs compare. I’ll give it a few weeks before deciding if it will make sense to switch tariffs. I probably need to wait until well into the Autumn to see how much colder weather and shorter days (affecting the UK’s solar power generation) affect the agile prices.
So far I’ve only seen one instance of negative prices. It won’t be hard to create an automation to exploit these should I choose to go agile. I’ll report back if I do.
Nice work! I recently switched to agile purely from the point of view that I want the ability to take advantage of price changes - I don't need to be isolated from the uncertainties of the grid, as like yourself, we have no major consumers of electricity and in theory can move our usage around to fit. So far we're cutting 25% off the fixed tariff quite easily by timing our cooking and laundry appropriately.
I also will be writing about some home automation findings but have subscribed to you also - looking forward to more posts!